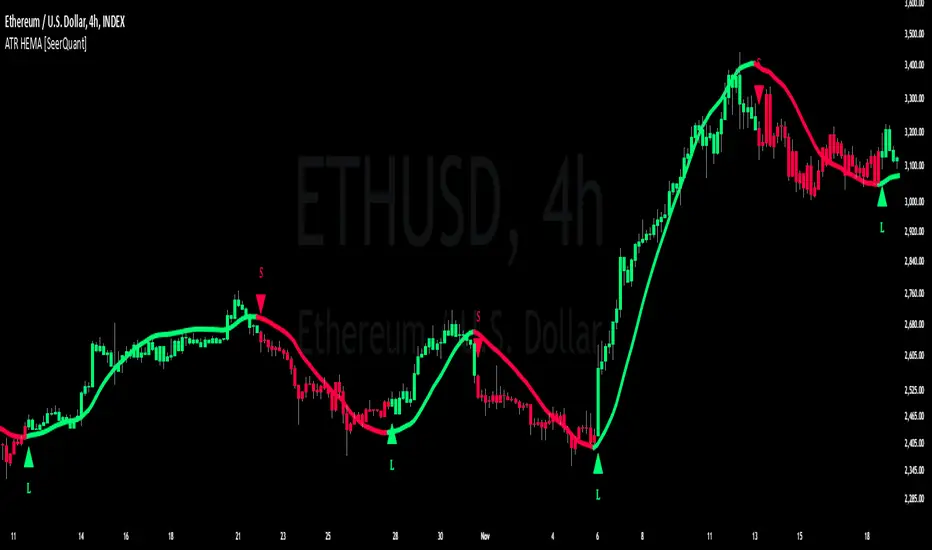
ATR HEMA [SeerQuant]What is the ATR Holt Moving Average (HEMA)?
The ATR Holt Moving Average (HEMA) is an advanced smoothing technique that incorporates the Holt exponential smoothing method. Unlike traditional moving averages, HEMA uses two smoothing factors (alpha and gamma) to forecast both the current trend and the trend change rate. This dual-layer approach improves the responsiveness of the moving average to both stable trends and volatile price swings.
When paired with the Average True Range (ATR), the HEMA becomes even more powerful. The ATR acts as a volatility filter, defining a "neutral zone" where minor price fluctuations are ignored. This allows traders to focus on significant market movements while reducing the impact of noise.
⚙️ How the Code Works
The ATR Holt Moving Average (HEMA) combines trend smoothing with volatility filtering to provide traders with dynamic signals. Here's how it functions step by step:
User Inputs and Customization:
Traders can customize the lengths for HEMA's smoothing factors (alphaL and gammaL), the ATR calculation length, and the neutral zone multiplier (atrMult).
The src input allows users to choose the price source for calculations (e.g., hl2), while the col input offers various color themes (Default, Modern, Warm, Cool).
Holt Exponential Moving Average (HEMA) Calculation:
Alpha and Gamma Smoothing Factors:
alpha controls how much weight is given to the current price versus past prices.
gamma smooths the trend change rate, reducing noise. The HEMA formula combines the current price, the previous HEMA value, and a trend adjustment (via the b variable) to create a smooth yet responsive average. The b variable tracks the rate of change in the HEMA over time, further refining the trend detection.
ATR-Based Neutral Zone:
If the change in HEMA (hemaChange) falls within the neutral zone, it is considered insignificant, and the trend color remains unchanged.
Color and Signal Detection:
Bullish Trend: The color is set to bull when HEMA rises above the neutral zone.
Bearish Trend: The color is set to bear when HEMA falls below the neutral zone.
Neutral Zone: The color remains unchanged, signalling no significant trend.
🚀 Summary
This indicator enhances traditional moving averages by combining the Holt smoothing method with ATR-based volatility filtering. The HEMA adapts to market conditions, detecting trends and transitions while filtering out insignificant price changes. The result is a versatile tool for:
The ATR Holt Moving Average (HEMA) is ideal for traders seeking a balance between responsiveness and stability, offering precise signals in both trending and volatile markets.
📜 Disclaimer
The information provided by this script is for educational and informational purposes only and does not constitute financial, investment, or trading advice. Past performance of any trading system or indicator, including this one, is not indicative of future results. Trading and investing in financial markets involve risk, and it is possible to lose your entire investment.
Users are advised to perform their own due diligence and consult with a licensed financial advisor before making any trading or investment decisions. The creator of this script is not responsible for any trading or investment decisions made based on the use of this script.
This script complies with TradingView's guidelines and is provided as-is, without any guarantee of accuracy, reliability, or performance. Use at your own risk.
Поиск скриптов по запросу "Exponential Moving Average"
EMA Volatility Channel [QuantAlgo]EMA Volatility Channel 🌊📈
The EMA Volatility Channel by QuantAlgo is an advanced technical indicator designed to capture price volatility and trend dynamics through adaptive channels based on exponential moving averages. This sophisticated system combines EMA-based trend analysis with dynamic volatility-adjusted bands to help traders and investors identify trend direction, potential reversals, and market volatility conditions. By evaluating both price momentum and volatility together, this tool enables users to make informed trading decisions while adapting to changing market conditions.
💫 Dynamic Channel Architecture
The EMA Volatility Channel provides a unique framework for assessing market trends through a blend of exponential moving averages and volatility-based channel calculations. Unlike traditional channel indicators that use fixed-width bands, this system incorporates dynamic volatility measurements to adjust channel width automatically, helping users determine whether price movements are significant relative to current market conditions. By combining smooth EMA trends with adaptive volatility bands, it evaluates both directional movement and market volatility, while the smoothing parameters ensure stable yet responsive channel adjustments. This adaptive approach allows users to identify trending conditions while remaining aware of volatility expansions and contractions, enhancing both trend-following and reversal strategies.
📊 Indicator Components & Mechanics
The EMA Volatility Channel is composed of several technical components that create a dynamic channel system:
EMA Midline: Calculates a smoothed exponential moving average that serves as the channel's centerline, providing a clear reference for trend direction.
Volatility Measurement: Computes average price movement to determine dynamic channel width, adapting to changing market conditions automatically.
Smooth Band Calculation: Applies additional smoothing to the channel bands, reducing noise while maintaining responsiveness to significant price movements.
📈 Key Indicators and Features
The EMA Volatility Channel combines various technical tools to deliver a comprehensive analysis of market conditions.
The indicator utilizes exponential moving averages with customizable length and smoothing parameters to adapt to different trading styles. Volatility calculations are applied to determine channel width, providing context-aware boundaries for price movement. The trend detection component evaluates price action relative to the channel bands, helping validate trends and identify potential reversals.
The indicator incorporates multi-layered visualization with color-coded channels and bars to signal both trend direction and market position. These adaptive visual cues, combined with programmable alerts for channel breakouts, help traders and investors track both trend changes and volatility conditions, supporting both trend-following and mean-reversion strategies.
⚡️ Practical Applications and Examples
✅ Add the Indicator: Add the indicator to your TradingView chart by clicking on the star icon to add it to your favorites ⭐️
👀 Monitor Channel Position: Watch the price position relative to the channel bands to identify trend direction and potential reversals. When price moves outside the channel, consider potential trend changes or extreme conditions.
🔔 Set Alerts: Configure alerts for channel breakouts and trend changes, ensuring you can act on significant technical developments promptly.
🌟 Summary and Tips
The EMA Volatility Channel by QuantAlgo is a versatile technical tool, designed to support both trend following and volatility analysis across different market environments. By combining smooth EMA trends with dynamic volatility-based channels, it helps traders and investors identify significant price movements while measuring market volatility, providing reliable technical signals. The tool's adaptability across timeframes makes it suitable for both trend-following and reversal strategies, allowing users to capture opportunities while maintaining awareness of changing market conditions.

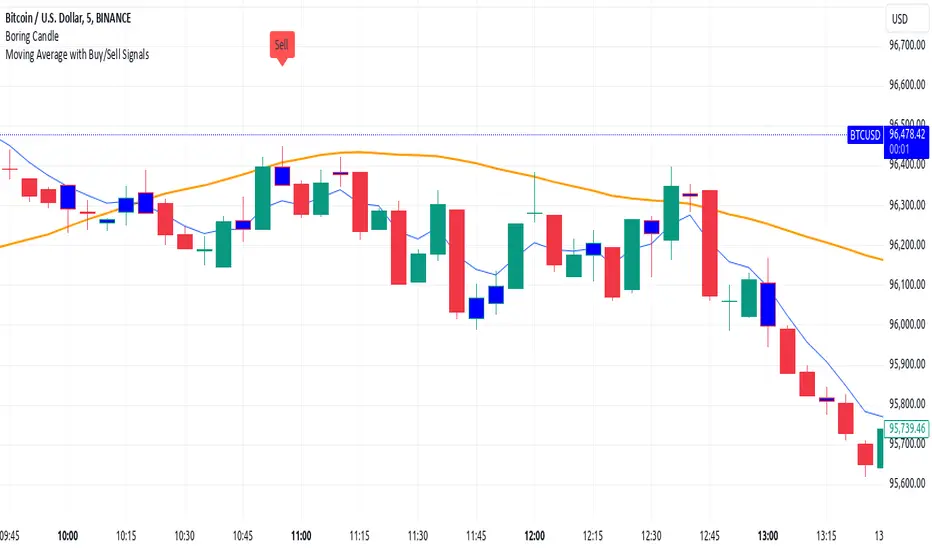
Moving Average with Buy/Sell SignalsBINANCE:BTCUSD
Pine Script Brief: "44 Moving Average with Buy/Sell Signals"
This Pine Script is designed to generate buy and sell signals based on the interaction of the price with the 44-period Simple Moving Average (SMA). It also considers the closing behavior of the last five candles to further refine the conditions for generating signals. The script is intended for use in technical analysis for trading strategies on platforms like TradingView.
Features:
44-Period Simple Moving Average (SMA):
The script calculates and plots the 44-period SMA of the closing price on the chart, providing a trend-following indicator.
The SMA is used as a key level to determine when price action is "touching" or interacting with the moving average.
Buy and Sell Signal Logic:
Buy Signal:
The candle is green (close > open).
The candle's high and low are around the 44 SMA, indicating the candle is "touching" or near the moving average.
At least 2 of the last 5 candles must have closed above the 44 SMA.
The 44 SMA is positioned below the midpoint of the current candle.
Sell Signal:
The candle is red (close < open).
The candle's high and low are around the 44 SMA.
At least 2 of the last 5 candles must have closed below the 44 SMA.
The 44 SMA is positioned above the midpoint of the current candle.
Label Plotting:
The script uses the plotSignal function to plot buy and sell labels directly on the chart. The labels are plotted at the low of a green candle (for buy signals) and the high of a red candle (for sell signals).
Labels are color-coded for quick identification: green for buy and red for sell.
EMA for Smoothing (Optional):
An optional Exponential Moving Average (EMA) is plotted for additional trend smoothing, allowing users to visualize another moving average for possible trend-following strategies.
The length of the EMA is customizable, and it is plotted on the chart alongside the 44 SMA.
Alert Conditions:
Alerts can be set up for both buy and sell signals, notifying the user when these conditions are met. The alerts are triggered whenever the script detects a valid buy or sell signal.
Customizable Inputs:
The script allows customization of the following:
Smoothing Length: For the optional EMA line.
Tolerance: For adjusting the proximity check (candle touching the 44 SMA).
Styling: The color and text of the buy and sell labels can be customized.
Usage:
This script can be used by traders who want to identify possible entry and exit points based on price interaction with the 44-period moving average, combined with the behavior of previous candles. It is suitable for trend-following strategies and can be used in conjunction with other indicators to refine trading decisions.
Key Benefits:
Provides visual signals (buy/sell) directly on the chart.
Considers both immediate price action and historical trends (previous candles).
Offers customization for moving averages and labels.
Alerts can be set for automated notifications.
This Pine Script helps traders make informed decisions by combining the reliability of moving averages with price action and historical candle behavior, enhancing trading strategies based on trend-following principles.
Fibonacci Moving Average PlusFibonacci Moving Average Plus is a sophisticated technical indicator that employs the first 15 numbers of the Fibonacci sequence to create dynamic moving average channels. This indicator aims to capture both immediate and long-term price movements by calculating Exponential Moving Averages (EMAs) based on these Fibonacci values. By using Fibonacci-based moving averages for both high and low price points, the indicator generates a visual channel that reflects the ebb and flow of market trends, acting as potential zones of support and resistance. Additionally, the indicator provides midline, retracement, and extension levels rooted in Fibonacci ratios, which are frequently observed as key levels for reversals or trend continuation.
Ideology Behind Using Fibonacci Sequence-Based Moving Averages
The Fibonacci sequence, known for its mathematical harmony and prevalence in natural patterns, is widely utilized in technical analysis to identify potential turning points in markets. In this indicator, the first 15 Fibonacci numbers (5, 8, 13, 21, etc.) are used as the lookback periods for EMAs to capture different layers of market sentiment. These moving averages represent timeframes that are theoretically in alignment with the natural rhythms of market cycles, where key levels—often coinciding with Fibonacci numbers—can act as magnetic points for price.
The Fibonacci high and low channels aim to encapsulate price action, giving traders a sense of whether the market is trending, consolidating, or experiencing reversal pressure. These levels, grounded in both mathematics and market psychology, help traders spot areas where price might face resistance or find support.
Key Features
Fibonacci Moving Average High and Low: This indicator calculates the high and low EMAs based on Fibonacci sequence numbers (e.g., 5, 8, 13, etc.) for enhanced trend analysis.
Golden Pocket Retracement (GPR) and Extension (GPE) Bands: Displays common Fibonacci retracement and extension levels (0.618, 0.65 for retracement, and 1.618, 1.65 for extension).
Midline: Plots the average of the Fibonacci high and low to act as an additional reference level.
Stop-Loss Levels: Provides suggested stop-loss levels based on Fibonacci levels for both long and short positions.
Basic User Guide
Adjust Input Settings:
Input Timeframe: Set a specific timeframe for the Fibonacci moving average calculation, separate from the chart's primary timeframe.
Show Fibonacci MA High/Low: Toggle the visibility of the high and low Fibonacci moving averages.
Show Mid Line: Display a midline for added trend reference.
Show Golden Pocket Bands: Choose to display retracement or extension bands for potential support or resistance zones.
Show Stop-Loss Levels: Enable to visualize potential stop-loss levels for both long and short trades.
Interpretation:
Fibonacci MA High and Low: Use these lines to gauge the general trend. When the price is above both, it may indicate an uptrend; below both, a downtrend.
Golden Pocket Retracement: This zone (between 0.618 and 0.65) is often a key level for potential reversals or support/resistance.
Golden Pocket Extension: The 1.618 and 1.65 levels can indicate potential profit-taking or trend exhaustion points.
Stop-Loss Levels: The calculated stop-loss levels (long SL below and short SL above) can aid in risk management.
Customization:
You can customize the appearance and visibility of each component through the input settings to fit your specific strategy and visual preferences.
This indicator should be used alongside other technical analysis tools to provide a more comprehensive trading approach.
This Indicator would not exist without the original contributions and blessing from Sofien Kaabar

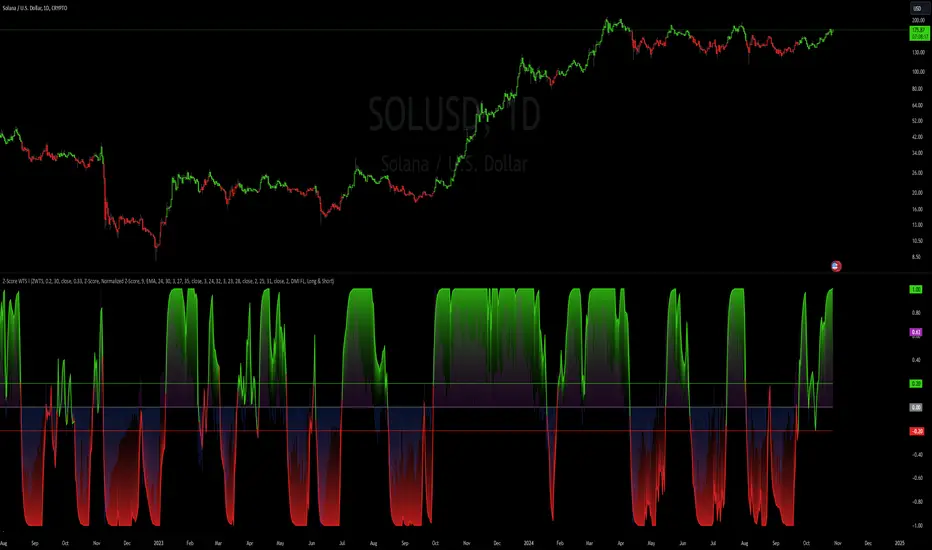
Z-Score Weighted Trend System I [InvestorUnknown]The Z-Score Weighted Trend System I is an advanced and experimental trading indicator designed to utilize a combination of slow and fast indicators for a comprehensive analysis of market trends. The system is designed to identify stable trends using slower indicators while capturing rapid market shifts through dynamically weighted fast indicators. The core of this indicator is the dynamic weighting mechanism that utilizes the Z-score of price , allowing the system to respond effectively to significant market movements.
Dynamic Z-Score-Based Weighting System
The Z-Score Weighted Trend System I utilizes the Z-score of price to assign weights dynamically to fast indicators. This mechanism is designed to capture rapid market shifts at potential turning points, providing timely entry and exit signals.
Traders can choose from two primary weighting mechanisms:
Threshold-Based Weighting: The fast indicators are given weight only when the absolute Z-score exceeds a user-defined threshold. Below this threshold, fast indicators have no impact on the final signal.
Continuous Weighting: By setting the threshold to zero, fast indicators always contribute to the final signal, regardless of Z-score levels. However, this increases the likelihood of false signals during ranging or low-volatility markets
// Calculate weight for Fast Indicators based on Z-Score (Slow Indicator weight is kept to 1 for simplicity)
f_zscore_weights(series float z, simple float weight_thre) =>
float fast_weight = na
float slow_weight = na
if weight_thre > 0
if math.abs(z) <= weight_thre
fast_weight := 0
slow_weight := 1
else
fast_weight := 0 + math.sqrt(math.abs(z))
slow_weight := 1
else
fast_weight := 0 + math.sqrt(math.abs(z))
slow_weight := 1
Choice of Z-Score Normalization
Traders have the flexibility to select different Z-score processing methods to better suit their trading preferences:
Raw Z-Score or Moving Average: Traders can opt for either the raw Z-score or a moving average of the Z-score to smooth out fluctuations.
Normalized Z-Score (ranging from -1 to 1) or Z-Score Percentile: The normalized Z-score is simply the raw Z-score divided by 3, while the Z-score percentile utilizes a normal distribution for transformation.
f_zscore_perc(series float zscore_src, simple int zscore_len, simple string zscore_a, simple string zscore_b, simple string ma_type, simple int ma_len) =>
z = (zscore_src - ta.sma(zscore_src, zscore_len)) / ta.stdev(zscore_src, zscore_len)
zscore = switch zscore_a
"Z-Score" => z
"Z-Score MA" => ma_type == "EMA" ? (ta.ema(z, ma_len)) : (ta.sma(z, ma_len))
output = switch zscore_b
"Normalized Z-Score" => (zscore / 3) > 1 ? 1 : (zscore / 3) < -1 ? -1 : (zscore / 3)
"Z-Score Percentile" => (f_percentileFromZScore(zscore) - 0.5) * 2
output
Slow and Fast Indicators
The indicator uses a combination of slow and fast indicators:
Slow Indicators (constant weight) for stable trend identification: DMI (Directional Movement Index), CCI (Commodity Channel Index), Aroon
Fast Indicators (dynamic weight) to identify rapid trend shifts: ZLEMA (Zero-Lag Exponential Moving Average), IIRF (Infinite Impulse Response Filter)
Each indicator is calculated using for-loop methods to provide a smoothed and averaged view of price data over varying lengths, ensuring stability for slow indicators and responsiveness for fast indicators.
Signal Calculation
The final trading signal is determined by a weighted combination of both slow and fast indicators. The slow indicators provide a stable view of the trend, while the fast indicators offer agile responses to rapid market movements. The signal calculation takes into account the dynamic weighting of fast indicators based on the Z-score:
// Calculate Signal (as weighted average)
float sig = math.round(((DMI*slow_w) + (CCI*slow_w) + (Aroon*slow_w) + (ZLEMA*fast_w) + (IIRF*fast_w)) / (3*slow_w + 2*fast_w), 2)
Backtest Mode and Performance Metrics
The indicator features a detailed backtesting mode, allowing traders to compare the effectiveness of their selected settings against a traditional Buy & Hold strategy. The backtesting provides:
Equity calculation based on signals generated by the indicator.
Performance metrics comparing Buy & Hold metrics with the system’s signals, including: Mean, positive, and negative return percentages, Standard deviations, Sharpe, Sortino, and Omega Ratios
// Calculate Performance Metrics
f_PerformanceMetrics(series float base, int Lookback, simple float startDate, bool Annualize = true) =>
// Initialize variables for positive and negative returns
pos_sum = 0.0
neg_sum = 0.0
pos_count = 0
neg_count = 0
returns_sum = 0.0
returns_squared_sum = 0.0
pos_returns_squared_sum = 0.0
neg_returns_squared_sum = 0.0
// Loop through the past 'Lookback' bars to calculate sums and counts
if (time >= startDate)
for i = 0 to Lookback - 1
r = (base - base ) / base
returns_sum += r
returns_squared_sum += r * r
if r > 0
pos_sum += r
pos_count += 1
pos_returns_squared_sum += r * r
if r < 0
neg_sum += r
neg_count += 1
neg_returns_squared_sum += r * r
float export_array = array.new_float(12)
// Calculate means
mean_all = math.round((returns_sum / Lookback), 4)
mean_pos = math.round((pos_count != 0 ? pos_sum / pos_count : na), 4)
mean_neg = math.round((neg_count != 0 ? neg_sum / neg_count : na), 4)
// Calculate standard deviations
stddev_all = math.round((math.sqrt((returns_squared_sum - (returns_sum * returns_sum) / Lookback) / Lookback)) * 100, 2)
stddev_pos = math.round((pos_count != 0 ? math.sqrt((pos_returns_squared_sum - (pos_sum * pos_sum) / pos_count) / pos_count) : na) * 100, 2)
stddev_neg = math.round((neg_count != 0 ? math.sqrt((neg_returns_squared_sum - (neg_sum * neg_sum) / neg_count) / neg_count) : na) * 100, 2)
// Calculate probabilities
prob_pos = math.round((pos_count / Lookback) * 100, 2)
prob_neg = math.round((neg_count / Lookback) * 100, 2)
prob_neu = math.round(((Lookback - pos_count - neg_count) / Lookback) * 100, 2)
// Calculate ratios
sharpe_ratio = math.round((mean_all / stddev_all * (Annualize ? math.sqrt(Lookback) : 1))* 100, 2)
sortino_ratio = math.round((mean_all / stddev_neg * (Annualize ? math.sqrt(Lookback) : 1))* 100, 2)
omega_ratio = math.round(pos_sum / math.abs(neg_sum), 2)
// Set values in the array
array.set(export_array, 0, mean_all), array.set(export_array, 1, mean_pos), array.set(export_array, 2, mean_neg),
array.set(export_array, 3, stddev_all), array.set(export_array, 4, stddev_pos), array.set(export_array, 5, stddev_neg),
array.set(export_array, 6, prob_pos), array.set(export_array, 7, prob_neu), array.set(export_array, 8, prob_neg),
array.set(export_array, 9, sharpe_ratio), array.set(export_array, 10, sortino_ratio), array.set(export_array, 11, omega_ratio)
// Export the array
export_array
//}
Calibration Mode
A Calibration Mode is included for traders to focus on individual indicators, helping them fine-tune their settings without the influence of other components. In Calibration Mode, the user can visualize each indicator separately, making it easier to adjust parameters.
Alerts
The indicator includes alerts for long and short signals when the indicator changes direction, allowing traders to set automated notifications for key market events.
// Alert Conditions
alertcondition(long_alert, "LONG (Z-Score Weighted Trend System)", "Z-Score Weighted Trend System flipped ⬆LONG⬆")
alertcondition(short_alert, "SHORT (Z-Score Weighted Trend System)", "Z-Score Weighted Trend System flipped ⬇Short⬇")
Important Note:
The default settings of this indicator are not optimized for any particular market condition. They are generic starting points for experimentation. Traders are encouraged to use the calibration tools and backtesting features to adjust the system to their specific trading needs.
The results generated from the backtest are purely historical and are not indicative of future results. Market conditions can change, and the performance of this system may differ under different circumstances. Traders and investors should exercise caution and conduct their own research before using this indicator for any trading decisions.
Dema AFR | viResearchDema AFR | viResearch
Conceptual Foundation and Innovation
The "Dema AFR" indicator combines the Double Exponential Moving Average (DEMA) with an Average True Range (ATR)-based adaptive factor to create a responsive and adaptable trend-following system. The DEMA is known for its ability to smooth price data while reducing lag, making it highly effective for trend detection. By incorporating the ATR as a volatility factor, this indicator adapts dynamically to market conditions, allowing traders to capture trends while accounting for changes in volatility. The result is the Adaptive Factor Range (AFR), which provides clear signals for potential trend shifts and helps manage risk through its adaptive nature. This combination of DEMA smoothing and an ATR-based factor enables traders to follow trends more effectively while maintaining sensitivity to changing market conditions.
Technical Composition and Calculation
The "Dema AFR" script consists of two main components: the Double Exponential Moving Average (DEMA) and the Adaptive Factor Range (AFR). The DEMA is calculated over a user-defined length, smoothing out price fluctuations while reducing lag compared to traditional moving averages. The ATR is used to create a dynamic factor that adjusts the AFR based on market volatility. The factor is calculated by multiplying the ATR by a user-defined factor value, which scales the ATR to define upper and lower bounds for the AFR. The Adaptive Factor Range is derived from the DEMA, with upper and lower bounds set by adding or subtracting the ATR-based factor from the DEMA. When the price moves outside these bounds, the AFR is adjusted, and signals are generated. If the lower bound is exceeded, the AFR adjusts upward, while exceeding the upper bound causes the AFR to adjust downward. This dynamic adjustment helps the indicator stay responsive to market movements.
Features and User Inputs
The "Dema AFR" script provides several customizable inputs, allowing traders to tailor the indicator to their strategies. The DEMA Length controls the smoothing period for the DEMA, while the ATR Period defines the window for calculating the Average True Range. The ATR Factor determines the scale of the adaptive factor, controlling how much the AFR adjusts to volatility. Additionally, customizable bar colors and alert conditions allow traders to visualize the trend direction and receive notifications when key trend shifts occur.
Practical Applications
The "Dema AFR" indicator is designed for traders who want to capture trends while adapting to market volatility. The adaptive nature of the AFR makes it responsive to trend changes, providing early signals of potential trend reversals as the AFR adjusts to market movements. By incorporating ATR into the AFR calculation, the indicator adjusts to changing volatility, helping traders manage risk by staying aligned with market conditions. The AFR also helps confirm whether a price move is supported by momentum, improving the accuracy of trade entries and exits.
Advantages and Strategic Value
The "Dema AFR" script offers a significant advantage by combining the smoothness of the DEMA with the adaptability of the ATR-based factor. This dynamic combination allows the indicator to adjust to market conditions, providing more reliable trend signals in both trending and volatile markets. The adaptive nature of the AFR reduces the risk of false signals and helps traders stay on the right side of the trend while managing risk through volatility-adjusted ranges.
Alerts and Visual Cues
The script includes alert conditions that notify traders of key trend changes. The "Dema AFR Long" alert is triggered when the AFR indicates a potential upward trend, while the "Dema AFR Short" alert signals a potential downward trend. Visual cues such as color changes in the bar chart help traders quickly identify shifts in trend direction, allowing them to make informed decisions in real time.
Summary and Usage Tips
The "Dema AFR | viResearch" indicator provides traders with a powerful tool for trend analysis by combining DEMA smoothing with an ATR-based adaptive factor. This script helps traders stay aligned with trends while accounting for market volatility, improving their ability to detect trend reversals and manage risk. By incorporating this indicator into your trading strategy, you can make more informed decisions, whether in trending or volatile market environments. The "Dema AFR" offers a reliable and flexible solution for traders at all levels.
Note: Backtests are based on past results and are not indicative of future performance.

MVSF 6.0[ELPANO]The "MVSF 6.0 " indicator, which stands for Multi-Variable Strategy Framework, overlays on price charts to aid in trading decisions. It combines various moving averages and volume data to generate buy and sell signals based on predefined conditions.
Key features of the indicator include:
Moving Averages: It uses three exponential moving averages (EMAs) with lengths of 200, 100, and 50, and two simple moving averages (SMAs) with lengths of 14 and 9. These averages are combined into a single average line to detect trends.
Volume Analysis: The volume is assessed over a specified period (default is 2 bars) to determine its trend relative to its average, influencing the color and interpretation of signals.
Price Source and VWAP: Users can select the price (close, low, or high) used for calculations. The volume-weighted average price (VWAP) serves as a potential benchmark or condition in signal generation.
Signal Generation: Buy and sell signals are based on the relationship of the price to the average line and VWAP, the direction of the last candle, and the trend direction of the average line. These signals are visually represented on the chart.
Customization: Traders can toggle the visibility of signals, entry points, the average line, and even use these elements as conditions for filtering signals.
This script is designed to be flexible, allowing traders to modify settings according to their strategy needs. The description and implementation aim to provide clarity on how each component works together to assist in trading decisions, adhering to best practices for creating and publishing trading scripts.
*************************************
Der Indikator "MVSF 6.0 ", der für Multi-Variable Strategy Framework steht, wird über Preisdiagramme gelegt, um bei Handelsentscheidungen zu helfen. Er kombiniert verschiedene gleitende Durchschnitte und Volumendaten, um Kauf- und Verkaufssignale basierend auf vordefinierten Bedingungen zu generieren.
Wesentliche Merkmale des Indikators umfassen:
Gleitende Durchschnitte: Es werden drei exponentielle gleitende Durchschnitte (EMAs) mit Längen von 200, 100 und 50 sowie zwei einfache gleitende Durchschnitte (SMAs) mit Längen von 14 und 9 verwendet. Diese Durchschnitte werden zu einer einzelnen Durchschnittslinie kombiniert, um Trends zu erkennen.
Volumenanalyse: Das Volumen wird über einen festgelegten Zeitraum (standardmäßig 2 Balken) bewertet, um seinen Trend im Vergleich zum Durchschnitt zu bestimmen, was die Farbe und Interpretation der Signale beeinflusst.
Preisquelle und VWAP: Benutzer können den für Berechnungen verwendeten Preis (Schluss-, Tief- oder Hochkurs) auswählen. Der volumengewichtete Durchschnittspreis (VWAP) dient als mögliche Benchmark oder Bedingung bei der Generierung von Signalen.
Signalgenerierung: Kauf- und Verkaufssignale basieren auf dem Verhältnis des Preises zur Durchschnittslinie und zum VWAP, der Richtung der letzten Kerze und der Trendrichtung der Durchschnittslinie. Diese Signale werden visuell auf dem Diagramm dargestellt.
Anpassung: Händler können die Sichtbarkeit von Signalen, Einstiegspunkten, der Durchschnittslinie und sogar deren Verwendung als Bedingungen für die Filterung von Signalen ein- und ausschalten.
Dieses Skript ist so konzipiert, dass es flexibel ist und Händlern erlaubt, die Einstellungen gemäß ihren Strategiebedürfnissen zu modifizieren. Die Beschreibung und Implementierung zielen darauf ab, Klarheit darüber zu schaffen, wie jede Komponente zusammenarbeitet, um bei Handelsentscheidungen zu helfen, und halten sich an die besten Praktiken für die Erstellung und Veröffentlichung von Handelsskripten.

Enhanced Trend Arrows with Moving Average [ST]Enhanced Trend Arrows with Moving Average
Description in English:
This indicator is designed to identify market trends using a moving average and displays arrows after three consecutive closes above or below the moving average. It helps traders visualize confirmed trends and make informed decisions.
Detailed Explanation:
Configuration:
Length: Defines the period over which the moving average is calculated. The default value is 14.
MA Type: Allows choosing between a Simple Moving Average (SMA) and an Exponential Moving Average (EMA).
Uptrend Color: Sets the color of the arrows indicating an uptrend. The default color is green.
Downtrend Color: Sets the color of the arrows indicating a downtrend. The default color is red.
Moving Average Calculation:
The moving average (MA) is calculated based on the selected type (SMA or EMA) and period. The SMA is the simple arithmetic mean of the closing prices over the specified period, while the EMA gives more weight to recent prices.
Trend Identification:
The script detects when the price crosses above (crossover) or below (crossunder) the moving average.
When a crossover occurs (price moves above the MA), it indicates a potential uptrend, and the trend variable is set to 1.
When a crossunder occurs (price moves below the MA), it indicates a potential downtrend, and the trend variable is set to -1.
The script tracks the closing price at the crossover or crossunder point using the trendPrice variable.
It also counts consecutive bars above or below the moving average to confirm the trend, using above_count for uptrend and below_count for downtrend.
Arrow Display:
The script displays an up arrow ("▲") after three consecutive closes above the moving average, indicating a confirmed uptrend.
Similarly, it displays a down arrow ("▼") after three consecutive closes below the moving average, indicating a confirmed downtrend.
The arrows are displayed at the trendPrice level to clearly indicate the point at which the trend was confirmed.
Indicator Benefits:
Trend Identification: Helps traders identify market trends using moving averages, which are widely used in technical analysis.
Visual Cues: The arrows provide clear visual signals for confirmed trends, making it easier for traders to make informed decisions.
New Features and Enhancements:
This script has been enhanced to provide more accurate trend identification by ensuring arrows are only displayed after three consecutive closes above or below the moving average.
The color customization options for uptrend and downtrend arrows have been added for better visualization.
Improved description and explanations to make the functionality and usage of the indicator clearer.

Volatility Adjusted Weighted DEMA [BackQuant]Volatility Adjusted Weighted DEMA
The Volatility Adjusted Weighted Double Exponential Moving Average (VAWDEMA) by BackQuant is a sophisticated technical analysis tool designed for traders seeking to integrate volatility into their moving average calculations. This innovative indicator adjusts the weighting of the Double Exponential Moving Average (DEMA) according to recent volatility levels, offering a more dynamic and responsive measure of market trends.
Primarily, the single Moving average is very noisy, but can be used in the context of strategy development, where as the crossover, is best used in the context of defining a trading zone/ macro uptrend on higher timeframes.
Why Volatility Adjustment is Beneficial
Volatility is a fundamental aspect of financial markets, reflecting the intensity of price changes. A volatility adjustment in moving averages is beneficial because it allows the indicator to adapt more quickly during periods of high volatility, providing signals that are more aligned with the current market conditions. This makes the VAWDEMA a versatile tool for identifying trend strength and potential reversal points in more volatile markets.
Understanding DEMA and Its Advantages
DEMA is an indicator that aims to reduce the lag associated with traditional moving averages by applying a double smoothing process. The primary benefit of DEMA is its sensitivity and quicker response to price changes, making it an excellent tool for trend following and momentum trading. Incorporating DEMA into your analysis can help capture trends earlier than with simple moving averages.
The Power of Combining Volatility Adjustment with DEMA
By adjusting the weight of the DEMA based on volatility, the VAWDEMA becomes a powerful hybrid indicator. This combination leverages the quick responsiveness of DEMA while dynamically adjusting its sensitivity based on current market volatility. This results in a moving average that is both swift and adaptive, capable of providing more relevant signals for entering and exiting trades.
Core Logic Behind VAWDEMA
The core logic of the VAWDEMA involves calculating the DEMA for a specified period and then adjusting its weighting based on a volatility measure, such as the average true range (ATR) or standard deviation of price changes. This results in a weighted DEMA that reflects both the direction and the volatility of the market, offering insights into potential trend continuations or reversals.
Utilizing the Crossover in a Trading System
The VAWDEMA crossover occurs when two VAWDEMAs of different lengths cross, signaling potential bullish or bearish market conditions. In a trading system, a crossover can be used as a trigger for entry or exit points:
Bullish Signal: When a shorter-period VAWDEMA crosses above a longer-period VAWDEMA, it may indicate an uptrend, suggesting a potential entry point for a long position.
Bearish Signal: Conversely, when a shorter-period VAWDEMA crosses below a longer-period VAWDEMA, it might signal a downtrend, indicating a possible exit point or a short entry.
Incorporating VAWDEMA crossovers into a trading strategy can enhance decision-making by providing timely and adaptive signals that account for both trend direction and market volatility. Traders should combine these signals with other forms of analysis and risk management techniques to develop a well-rounded trading strategy.
Alert Conditions For Trading
alertcondition(vwdema>vwdema , title="VWDEMA Long", message="VWDEMA Long - {{ticker}} - {{interval}}")
alertcondition(vwdema

Machine Learning : Cosine Similarity & Euclidean DistanceIntroduction:
This script implements a comprehensive trading strategy that adheres to the established rules and guidelines of housing trading. It leverages advanced machine learning techniques and incorporates customised moving averages, including the Conceptive Price Moving Average (CPMA), to provide accurate signals for informed trading decisions in the housing market. Additionally, signal processing techniques such as Lorentzian, Euclidean distance, Cosine similarity, Know sure thing, Rational Quadratic, and sigmoid transformation are utilised to enhance the signal quality and improve trading accuracy.
Features:
Market Analysis: The script utilizes advanced machine learning methods such as Lorentzian, Euclidean distance, and Cosine similarity to analyse market conditions. These techniques measure the similarity and distance between data points, enabling more precise signal identification and enhancing trading decisions.
Cosine similarity:
Cosine similarity is a measure used to determine the similarity between two vectors, typically in a high-dimensional space. It calculates the cosine of the angle between the vectors, indicating the degree of similarity or dissimilarity.
In the context of trading or signal processing, cosine similarity can be employed to compare the similarity between different data points or signals. The vectors in this case represent the numerical representations of the data points or signals.
Cosine similarity ranges from -1 to 1, with 1 indicating perfect similarity, 0 indicating no similarity, and -1 indicating perfect dissimilarity. A higher cosine similarity value suggests a closer match between the vectors, implying that the signals or data points share similar characteristics.
Lorentzian Classification:
Lorentzian classification is a machine learning algorithm used for classification tasks. It is based on the Lorentzian distance metric, which measures the similarity or dissimilarity between two data points. The Lorentzian distance takes into account the shape of the data distribution and can handle outliers better than other distance metrics.
Euclidean Distance:
Euclidean distance is a distance metric widely used in mathematics and machine learning. It calculates the straight-line distance between two points in Euclidean space. In two-dimensional space, the Euclidean distance between two points (x1, y1) and (x2, y2) is calculated using the formula sqrt((x2 - x1)^2 + (y2 - y1)^2).
Dynamic Time Windows: The script incorporates a dynamic time window function that allows users to define specific time ranges for trading. It checks if the current time falls within the specified window to execute the relevant trading signals.
Custom Moving Averages: The script includes the CPMA, a powerful moving average calculation. Unlike traditional moving averages, the CPMA provides improved support and resistance levels by considering multiple price types and employing a combination of Exponential Moving Averages (EMAs) and Simple Moving Averages (SMAs). Its adaptive nature ensures responsiveness to changes in price trends.
Signal Processing Techniques: The script applies signal processing techniques such as Know sure thing, Rational Quadratic, and sigmoid transformation to enhance the quality of the generated signals. These techniques improve the accuracy and reliability of the trading signals, aiding in making well-informed trading decisions.
Trade Statistics and Metrics: The script provides comprehensive trade statistics and metrics, including total wins, losses, win rate, win-loss ratio, and early signal flips. These metrics offer valuable insights into the performance and effectiveness of the trading strategy.
Usage:
Configuring Time Windows: Users can customize the time windows by specifying the start and finish time ranges according to their trading preferences and local market conditions.
Signal Interpretation: The script generates long and short signals based on the analysis, custom moving averages, and signal processing techniques. Users should pay attention to these signals and take appropriate action, such as entering or exiting trades, depending on their trading strategies.
Trade Statistics: The script continuously tracks and updates trade statistics, providing users with a clear overview of their trading performance. These statistics help users assess the effectiveness of the strategy and make informed decisions.
Conclusion:
With its adherence to housing trading rules, advanced machine learning methods, customized moving averages like the CPMA, and signal processing techniques such as Lorentzian, Euclidean distance, Cosine similarity, Know sure thing, Rational Quadratic, and sigmoid transformation, this script offers users a powerful tool for housing market analysis and trading. By leveraging the provided signals, time windows, and trade statistics, users can enhance their trading strategies and improve their overall trading performance.
Disclaimer:
Please note that while this script incorporates established tradingview housing rules, advanced machine learning techniques, customized moving averages, and signal processing techniques, it should be used for informational purposes only. Users are advised to conduct their own analysis and exercise caution when making trading decisions. The script's performance may vary based on market conditions, user settings, and the accuracy of the machine learning methods and signal processing techniques. The trading platform and developers are not responsible for any financial losses incurred while using this script.
By publishing this script on the platform, traders can benefit from its professional presentation, clear instructions, and the utilisation of advanced machine learning techniques, customised moving averages, and signal processing techniques for enhanced trading signals and accuracy.
I extend my gratitude to TradingView, LUX ALGO, and JDEHORTY for their invaluable contributions to the trading community. Their innovative scripts, meticulous coding patterns, and insightful ideas have profoundly enriched traders' strategies, including my own.

Momentum Ratio Oscillator [Loxx]What is Momentum Ratio Oscillator?
The theory behind this indicator involves utilizing a sequence of exponential moving average (EMA) calculations to achieve a smoother value of momentum ratio, which compares the current value to the previous one. Although this results in an outcome similar to that of some pre-existing indicators (such as volume zone or price zone oscillators), the use of EMA for smoothing is what sets it apart. EMA produces a smooth step-like output when values undergo sudden changes, whereas the mathematics used for those other indicators are completely distinct. This is a concept by the beloved Mladen of FX forums.
To utilize this version of the indicator, you have the option of using either levels, middle, or signal crosses for signals. The indicator is range bound from 0 to 1.
What is an EMA?
EMA stands for Exponential Moving Average, which is a type of moving average that is commonly used in technical analysis to smooth out price data and identify trends.
In a simple moving average (SMA), each data point is given equal weight when calculating the average. For example, if you are calculating the 10-day SMA, you would add up the prices for the past 10 days and divide by 10 to get the average. In contrast, in an EMA, more weight is given to recent prices, while older prices are given less weight.
The formula for calculating an EMA involves using a smoothing factor that is multiplied by the difference between the current price and the previous EMA value, and then adding this to the previous EMA value. The smoothing factor is typically calculated based on the length of the EMA being used. For example, a 10-day EMA might use a smoothing factor of 2/(10+1) or 0.1818.
The result of using an EMA is that the line produced is more responsive to recent price changes than a simple moving average. This makes it useful for identifying short-term trends and potential trend reversals. However, it can also be more volatile and prone to whipsaws, so it is often used in combination with other indicators to confirm signals.
Overall, the EMA is a widely used and versatile tool in technical analysis, and its effectiveness depends on the specific context in which it is applied.
What is Momentum?
In technical analysis, momentum refers to the rate of change of an asset's price over a certain period of time. It is often used to identify trends and potential trend reversals in financial markets.
Momentum is calculated by subtracting the closing price of an asset X days ago from its current closing price, where X is the number of days being used for the calculation. The result is the momentum value for that particular day. A positive momentum value suggests that prices are increasing, while a negative value indicates that prices are decreasing.
Traders use momentum in a variety of ways. One common approach is to look for divergences between the momentum indicator and the price of the asset being traded. For example, if an asset's price is trending upwards but its momentum is trending downwards, this could be a sign of a potential trend reversal.
Another popular strategy is to use momentum to identify overbought and oversold conditions in the market. When an asset's price has been rising rapidly and its momentum is high, it may be considered overbought and due for a correction. Conversely, when an asset's price has been falling rapidly and its momentum is low, it may be considered oversold and due for a bounce back up.
Momentum is also often used in conjunction with other technical indicators, such as moving averages or Bollinger Bands, to confirm signals and improve the accuracy of trading decisions.
Overall, momentum is a useful tool for traders and investors to analyze price movements and identify potential trading opportunities. However, like all technical indicators, it should be used in conjunction with other forms of analysis and with consideration of the broader market context.
Extras
Alerts
Signals
Loxx's Expanded Source Types, see here for details

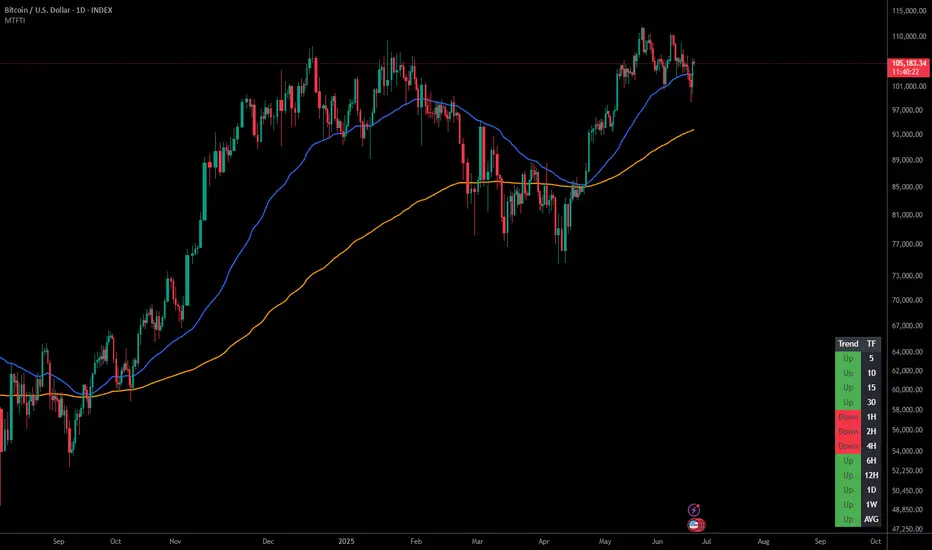
Multi-Timeframe Trend IndicatorThe Multi-Timeframe Trend Indicator (MTFTI) is a trend analysis tool designed to help traders quickly and easily assess the market direction across multiple timeframes. With the help of a table to visualize the trends on different timeframes.
Key features:
Multi-timeframe trend indicator for the following timeframes: 5 minutes, 15 minutes, 30 minutes, 1 hour, 2 hours, 4 hours, 6 hours, 12 hours, 1 day, and 1 week and average.
Displays trends for selected timeframes in a table.
Considers short and long-term exponential moving averages (EMAs) to determine trends.
Calculation of the average trend for all timeframes.
Display of trends with appropriate coloring for better readability (green for "Up", red for "Down", and intermediate shades for neutral or strong trends).
List of Parameters
Customization of the table's position on the screen (top-left, top-right, middle-left, middle-right, bottom-left, bottom-right).
Setting the lengths of the short and long-term exponential moving averages.
Option to activate or deactivate the display of EMAs for better customization (true by default).
Please note that the MTFTI is not a guarantee of future market performance and should be used in conjunction with proper risk management. Always ensure that you have a thorough understanding of the indicator’s methodology and its limitations before making any investment decisions. Additionally, past performance is not indicative of future results.
Stochastic MACD - Slow and FastStochastic MACD - Slow and Fast
The "Stochastic MACD - Slow and Fast" indicator combines two popular technical indicators, the Stochastic Oscillator and the Moving Average Convergence Divergence ( MACD ).
The Stochastic Oscillator is a momentum indicator that measures the current closing position of an asset relative to its recent price range. This indicator helps traders identify possible turning points in an asset's trend, it is used to identify if the market is overbought or oversold.
On the other hand, the MACD is an indicator used to identify the trend and strength of the market and shows the difference between two exponential moving averages ( EMA ) of different periods. The MACD is commonly used to determine the direction of an asset's price trend.
The combination of both indicators can help traders identify market entry and exit opportunities. This indicator has two parts: a slow part and a fast part. The slow part uses input values for the lengths of the moving averages and the length of the signal for the MACD indicator. The fast part uses different input values for the lengths of the moving averages. Also, each part has its own set of line colors and histogram colors for easy visualization.
In general, the "Stochastic MACD - Slow and Fast" indicator is used to identify possible turning points in the trend of an asset. Traders can use the indicator to determine when to enter or exit a position based on the signals generated by the indicator. The stochastic MACD is a variation of the regular MACD that incorporates a stochastic oscillator to provide additional signals.
In summary, this indicator can be useful for those looking for a combination of two popular indicators to help identify trading opportunities.
In addition, parameters were defined to activate or deactivate the graphic signal.
When the Stochastic MACD Slow Line Crosses the Stochastic MACD Slow Signal Line:
Long or Buy = ↑ // The Entry is more Effective if it is made when the signal is below the Zero Trend Line .
Short or Sell = ↓ // The Entry is more Effective if it is made when the signal is above the Zero Trend Line .
When the Fast Stochastic MACD Line Crosses the Slow Stochastic MACD Line:
Long or Buy = ▲ // The Entry is more Effective if it is made when the signal is below the Zero Trend Line .
Short or Sell = ▼ // The Entry is more Effective if it is made when the signal is above the Zero Trend Line .
Taking into account the above, alerts were also defined for possible Purchases or Sales or entries in Long or Short.
COPOSITION AND USE OF THE INDICATOR
This script is an implementation of the Stochastic MACD indicator with two variations - Slow and Fast. It uses a combination of the Stochastic Oscillator and the Moving Average Convergence Divergence (MACD) indicator to identify trend reversals and momentum shifts in the price of an asset.
The Slow version of the Stochastic MACD is built using three inputs - fastLength, slowLength, and signalLength. The fastLength and slowLength are used to calculate two exponential moving averages (EMAs), while the signalLength is used to calculate a signal line as an EMA of the difference between the two EMAs. The Stochastic Oscillator is then applied to the difference between the two EMAs, and the resulting values are plotted on the chart.
The Fast version of the Stochastic MACD is built using the same inputs as the Slow version, but with different values. It uses a shorter fastLength value and a longer slowLength value to generate the two EMAs, and the resulting values are plotted on the chart.
The script also includes inputs for choosing the type of moving average to use (SMA, EMA, etc.), the source of price data (open, close, etc.), the lookback period, and the colors for the lines and histogram bars.
This script can be used in different markets such as forex, indices, and cryptocurrencies for analysis and trading. However, it is important to note that no trading strategy is guaranteed to be profitable, and traders should always conduct their own research and risk management.

Adaptive MA constructor [lastguru]Adaptive Moving Averages are nothing new, however most of them use EMA as their MA of choice once the preferred smoothing length is determined. I have decided to make an experiment and separate length generation from smoothing, offering multiple alternatives to be combined. Some of the combinations are widely known, some are not. This indicator is based on my previously published public libraries and also serve as a usage demonstration for them. I will try to expand the collection (suggestions are welcome), however it is not meant as an encyclopaedic resource, so you are encouraged to experiment yourself: by looking on the source code of this indicator, I am sure you will see how trivial it is to use the provided libraries and expand them with your own ideas and combinations. I give no recommendation on what settings to use, but if you find some useful setting, combination or application ideas (or bugs in my code), I would be happy to read about them in the comments section.
The indicator works in three stages: Prefiltering, Length Adaptation and Moving Averages.
Prefiltering is a fast smoothing to get rid of high-frequency (2, 3 or 4 bar) noise.
Adaptation algorithms are roughly subdivided in two categories: classic Length Adaptations and Cycle Estimators (they are also implemented in separate libraries), all are selected in Adaptation dropdown. Length Adaptation used in the Adaptive Moving Averages and the Adaptive Oscillators try to follow price movements and accelerate/decelerate accordingly (usually quite rapidly with a huge range). Cycle Estimators, on the other hand, try to measure the cycle period of the current market, which does not reflect price movement or the rate of change (the rate of change may also differ depending on the cycle phase, but the cycle period itself usually changes slowly).
Chande (Price) - based on Chande's Dynamic Momentum Index (CDMI or DYMOI), which is dynamic RSI with this length
Chande (Volume) - a variant of Chande's algorithm, where volume is used instead of price
VIDYA - based on VIDYA algorithm. The period oscillates from the Lower Bound up (slow)
VIDYA-RS - based on Vitali Apirine's modification of VIDYA algorithm (he calls it Relative Strength Moving Average). The period oscillates from the Upper Bound down (fast)
Kaufman Efficiency Scaling - based on Efficiency Ratio calculation originally used in KAMA
Deviation Scaling - based on DSSS by John F. Ehlers
Median Average - based on Median Average Adaptive Filter by John F. Ehlers
Fractal Adaptation - based on FRAMA by John F. Ehlers
MESA MAMA Alpha - based on MESA Adaptive Moving Average by John F. Ehlers
MESA MAMA Cycle - based on MESA Adaptive Moving Average by John F. Ehlers, but unlike Alpha calculation, this adaptation estimates cycle period
Pearson Autocorrelation* - based on Pearson Autocorrelation Periodogram by John F. Ehlers
DFT Cycle* - based on Discrete Fourier Transform Spectrum estimator by John F. Ehlers
Phase Accumulation* - based on Dominant Cycle from Phase Accumulation by John F. Ehlers
Length Adaptation usually take two parameters: Bound From (lower bound) and To (upper bound). These are the limits for Adaptation values. Note that the Cycle Estimators marked with asterisks(*) are very computationally intensive, so the bounds should not be set much higher than 50, otherwise you may receive a timeout error (also, it does not seem to be a useful thing to do, but you may correct me if I'm wrong).
The Cycle Estimators marked with asterisks(*) also have 3 checkboxes: HP (Highpass Filter), SS (Super Smoother) and HW (Hann Window). These enable or disable their internal prefilters, which are recommended by their author - John F. Ehlers. I do not know, which combination works best, so you can experiment.
Chande's Adaptations also have 3 additional parameters: SD Length (lookback length of Standard deviation), Smooth (smoothing length of Standard deviation) and Power (exponent of the length adaptation - lower is smaller variation). These are internal tweaks for the calculation.
Length Adaptaton section offer you a choice of Moving Average algorithms. Most of the Adaptations are originally used with EMA, so this is a good starting point for exploration.
SMA - Simple Moving Average
RMA - Running Moving Average
EMA - Exponential Moving Average
HMA - Hull Moving Average
VWMA - Volume Weighted Moving Average
2-pole Super Smoother - 2-pole Super Smoother by John F. Ehlers
3-pole Super Smoother - 3-pole Super Smoother by John F. Ehlers
Filt11 -a variant of 2-pole Super Smoother with error averaging for zero-lag response by John F. Ehlers
Triangle Window - Triangle Window Filter by John F. Ehlers
Hamming Window - Hamming Window Filter by John F. Ehlers
Hann Window - Hann Window Filter by John F. Ehlers
Lowpass - removes cyclic components shorter than length (Price - Highpass)
DSSS - Derivation Scaled Super Smoother by John F. Ehlers
There are two Moving Averages that are drown on the chart, so length for both needs to be selected. If no Adaptation is selected ( None option), you can set Fast Length and Slow Length directly. If an Adaptation is selected, then Cycle multiplier can be selected for Fast and Slow MA.
More information on the algorithms is given in the code for the libraries used. I am also very grateful to other TradingView community members (they are also mentioned in the library code) without whom this script would not have been possible.

HEYC-Bands-Strategy by HassonyaHey guys, HEYC-Bands-Strategy indicator is moving average envelopes trend tracker system are pivot-based envelopes set above and below a moving average. Envelope is then set the high and low above or below the moving average. This creates parallel bands that follow price action. With a moving average as the base, Moving Average Envelopes can be used as a trend following indicator. However, this indicator is not limited to just trend following. You can also use it as support and resistance. The indicator aims to ensure that you follow the trend with maximum consistency and stay in the trend.
The indicator has 15 different options that form the basis of the moving average. What options are these?
- EMA - Exponential Moving Average
- WMA - Weighted Moving Average
- VWMA - Volume-Weighted Moving Average
- DEMA - Double Exponential Moving Average
- TEMA - Triple Exponential Moving Average
- LAGMA - Laguerre Moving Average
- HULLMA - Hull Moving Average
- EHMA - Exponential Hull Moving Average
- ETMA - Exponential Triangular Moving Average
- SSMA - Super-Smoother Moving Average
- ALMA - Arnaud Legoux Moving Average
- VIDYA - Variable Index Dynamic Average
- STMA - Triangular Moving Average
- ZEMA - Zero-Lag Exponential Moving Average
- SMA - Simple Moving Average
With the simplest logic, you can use it as buy when the price closes on the band, and sell when the price closes below the band.
Vertical lines and background guide you in the buying/selling trend changes in the indicator settings.
Thanks for support

5/22 Cross by bistatistic"5/22 Cross by bistatistic" is an indicator prepared using exponential moving averages. It can be used in the graphics of stock and money markets, especially the bitcoin market.
The intersection times of 5-day and 22-day exponential moving averages allow us to decide the direction of the trend.
We can use the buy and sell signals of 5/22 Cross as follows:
If the 5-day exponential moving average crosses the 22-day exponential moving average upward, buy it,
If the 5-day exponential moving average crosses the 22-day exponential moving average downward, sell it.
I think it gives good results in periods of 1 hour or more. As the time period grows, the probability of giving correct results will increase.
***
"5/22 Cross by bistatistic" üssel hareketli ortalamalar kullanılarak hazırlanmış bir göstergedir. Bitcoin piyasası başta olmak üzere hisse senedi ve para piyasalarının grafiklerinde kullanılabilmektedir.
5 günlük ve 22 günlük üssel hareketli ortalamaların kesişim zamanları trendin yönüne karar vermemizi sağlar.
5/22 Cross'un alış ve satış sinyallerini şu şekilde kullanabiliriz :
Eğer 5 günlük üssel hareketli ortalama 22 günlük üssel hareketli ortalama ile yukarı yönlü kesişirse satın alın,
Eğer 5 günlük üssel hareketli ortalama, 22 günlük üssel hareketli ortalama ile aşağı yönlü kesişirse sat.
Daha çok 1 saatlik ve üzeri periyotlarda iyi sonuçlar verdiğini düşünüyorum. Zaman periyodu büyüdükçe doğru sonuç verme olasılığı da artacaktır.

Schaff Trend Cycle + Double MAThis strategy uses two different moving averages to determine a trend. It opens a position on a pullback from a trend.
Conditions for buy signal are:
►Crossover out of Shaff Trend Cycle's extreme levels
►The price is above its short period exponential moving average.
►A short period exponential moving average is above a long period exponential moving average.
*Conditions for sell are the opposite.
All in all, I don't think it needs to be on your chart but it can be optimized and even successful on some timeframes.
Shaff Trend Cycle solution was provided by @everget, I converted his script to Pine v.4, added exponential averages and created an algorithm for backtesting.
Colored Moving Averages Can Help You Spot TrendsMoving averages are perhaps the most popular indicator in technical analysis. But sometimes they're not the easiest to interpret.
This indicator helps you see the trend by coloring the MA based on its direction. It's green when rising and red when falling. Of course, you can easily change that in the Style tab under Settings.
Color MA also lets you select from five different types of moving averages, including simple, exponential and Hull. We've included a list for easy reference below. Just change the "AvgType" on the Input tab under Settings.
This chart of Facebook shows the 20-day simple moving average. Notice how swings often marked turns in the stock price.
AvgType codes:
1 - Simple Moving Average
2 - Exponential Moving Average
3 - Hull Moving Average
4 - Weighted Moving Average
5 - Volume Weighted Moving Average

moving_averages# MovingAverages Library - PineScript v6
A comprehensive PineScript v6 library containing **50+ Moving Average calculations** for TradingView.
---
## 📦 Installation
```pinescript
import TheTradingSpiderMan/moving_averages/1 as MA
```
---
## 📊 All Available Moving Averages (50+)
### Basic Moving Averages
| Function | Selector Key | Description |
| -------- | ------------ | ------------------------------------------ |
| `sma()` | `SMA` | Simple Moving Average - arithmetic mean |
| `ema()` | `EMA` | Exponential Moving Average |
| `wma()` | `WMA` | Weighted Moving Average |
| `vwma()` | `VWMA` | Volume Weighted Moving Average |
| `rma()` | `RMA` | Relative/Smoothed Moving Average |
| `smma()` | `SMMA` | Smoothed Moving Average (alias for RMA) |
| `swma()` | - | Symmetrically Weighted MA (4-period fixed) |
### Hull Family
| Function | Selector Key | Description |
| -------- | ------------ | ------------------------------- |
| `hma()` | `HMA` | Hull Moving Average |
| `ehma()` | `EHMA` | Exponential Hull Moving Average |
### Double/Triple Smoothed
| Function | Selector Key | Description |
| -------------- | ------------ | --------------------------------- |
| `dema()` | `DEMA` | Double Exponential Moving Average |
| `tema()` | `TEMA` | Triple Exponential Moving Average |
| `tma()` | `TMA` | Triangular Moving Average |
| `t3()` | `T3` | Tillson T3 Moving Average |
| `twma()` | `TWMA` | Triple Weighted Moving Average |
| `swwma()` | `SWWMA` | Smoothed Weighted Moving Average |
| `trixSmooth()` | `TRIXSMOOTH` | Triple EMA Smoothed |
### Zero/Low Lag
| Function | Selector Key | Description |
| --------- | ------------ | ----------------------------------- |
| `zlema()` | `ZLEMA` | Zero Lag Exponential MA |
| `lsma()` | `LSMA` | Least Squares Moving Average |
| `epma()` | `EPMA` | Endpoint Moving Average |
| `ilrs()` | `ILRS` | Integral of Linear Regression Slope |
### Adaptive Moving Averages
| Function | Selector Key | Description |
| ---------- | ------------ | ------------------------------- |
| `kama()` | `KAMA` | Kaufman Adaptive Moving Average |
| `frama()` | `FRAMA` | Fractal Adaptive Moving Average |
| `vidya()` | `VIDYA` | Variable Index Dynamic Average |
| `vma()` | `VMA` | Variable Moving Average |
| `vama()` | `VAMA` | Volume Adjusted Moving Average |
| `rvma()` | `RVMA` | Rolling VMA |
| `apexMA()` | `APEXMA` | Apex Moving Average |
### Ehlers Filters
| Function | Selector Key | Description |
| ----------------- | --------------- | --------------------------------- |
| `superSmoother()` | `SUPERSMOOTHER` | Ehlers Super Smoother |
| `butterworth2()` | `BUTTERWORTH2` | 2-Pole Butterworth Filter |
| `butterworth3()` | `BUTTERWORTH3` | 3-Pole Butterworth Filter |
| `instantTrend()` | `INSTANTTREND` | Ehlers Instantaneous Trendline |
| `edsma()` | `EDSMA` | Deviation Scaled Moving Average |
| `mama()` | `MAMA` | Mesa Adaptive Moving Average |
| `fama()` | `FAMAVAL` | Following Adaptive Moving Average |
### Laguerre Family
| Function | Selector Key | Description |
| -------------------- | ------------------ | ------------------------ |
| `laguerreFilter()` | `LAGUERRE` | Laguerre Filter |
| `adaptiveLaguerre()` | `ADAPTIVELAGUERRE` | Adaptive Laguerre Filter |
### Special Weighted
| Function | Selector Key | Description |
| ---------- | ------------ | -------------------------------- |
| `alma()` | `ALMA` | Arnaud Legoux Moving Average |
| `sinwma()` | `SINWMA` | Sine Weighted Moving Average |
| `gwma()` | `GWMA` | Gaussian Weighted Moving Average |
| `nma()` | `NMA` | Natural Moving Average |
### Jurik/McGinley/Coral
| Function | Selector Key | Description |
| ------------ | ------------ | --------------------- |
| `jma()` | `JMA` | Jurik Moving Average |
| `mcginley()` | `MCGINLEY` | McGinley Dynamic |
| `coral()` | `CORAL` | Coral Trend Indicator |
### Mean Types
| Function | Selector Key | Description |
| -------------- | ------------ | ------------------------- |
| `medianMA()` | `MEDIANMA` | Median Moving Average |
| `gma()` | `GMA` | Geometric Moving Average |
| `harmonicMA()` | `HARMONICMA` | Harmonic Moving Average |
| `trimmedMA()` | `TRIMMEDMA` | Trimmed Moving Average |
| `cma()` | `CMA` | Cumulative Moving Average |
### Volume-Based
| Function | Selector Key | Description |
| --------- | ------------ | -------------------------- |
| `evwma()` | `EVWMA` | Elastic Volume Weighted MA |
### Other Specialized
| Function | Selector Key | Description |
| ----------------- | --------------- | --------------------------- |
| `hwma()` | `HWMA` | Holt-Winters Moving Average |
| `gdema()` | `GDEMA` | Generalized DEMA |
| `rema()` | `REMA` | Regularized EMA |
| `modularFilter()` | `MODULARFILTER` | Modular Filter |
| `rmt()` | `RMT` | Recursive Moving Trendline |
| `qrma()` | `QRMA` | Quadratic Regression MA |
| `wilderSmooth()` | `WILDERSMOOTH` | Welles Wilder Smoothing |
| `leoMA()` | `LEOMA` | Leo Moving Average |
| `ahrensMA()` | `AHRENSMA` | Ahrens Moving Average |
| `runningMA()` | `RUNNINGMA` | Running Moving Average |
| `ppoMA()` | `PPOMA` | PPO-based Moving Average |
| `fisherMA()` | `FISHERMA` | Fisher Transform MA |
---
## 🎯 Helper Functions
| Function | Description |
| ---------------- | ------------------------------------------------------------- |
| `wcp()` | Weighted Close Price: (H+L+2\*C)/4 |
| `typicalPrice()` | Typical Price: (H+L+C)/3 |
| `medianPrice()` | Median Price: (H+L)/2 |
| `selector()` | **Master selector** - choose any MA by string name |
| `getAllTypes()` | Returns all supported MA type names as comma-separated string |
---
## 🔧 Usage Examples
### Basic Usage
```pinescript
//@version=6
indicator("MA Example")
import quantablex/moving_averages/1 as MA
// Simple calls
plot(MA.sma(close, 20), "SMA 20", color.blue)
plot(MA.ema(close, 20), "EMA 20", color.red)
plot(MA.hma(close, 20), "HMA 20", color.green)
```
### Using the Selector Function (50+ MA Types)
```pinescript
//@version=6
indicator("MA Selector")
import quantablex/moving_averages/1 as MA
// Full list of all supported types:
// SMA,EMA,WMA,VWMA,RMA,SMMA,HMA,EHMA,DEMA,TEMA,TMA,T3,TWMA,SWWMA,TRIXSMOOTH,
// ZLEMA,LSMA,EPMA,ILRS,KAMA,FRAMA,VIDYA,VMA,VAMA,RVMA,APEXMA,SUPERSMOOTHER,
// BUTTERWORTH2,BUTTERWORTH3,INSTANTTREND,EDSMA,LAGUERRE,ADAPTIVELAGUERRE,
// ALMA,SINWMA,GWMA,NMA,JMA,MCGINLEY,CORAL,MEDIANMA,GMA,HARMONICMA,TRIMMEDMA,
// EVWMA,HWMA,GDEMA,REMA,MODULARFILTER,RMT,QRMA,WILDERSMOOTH,LEOMA,AHRENSMA,
// RUNNINGMA,PPOMA,MAMA,FAMAVAL,FISHERMA,CMA
maType = input.string("EMA", "MA Type", options= )
length = input.int(20, "Length")
plot(MA.selector(close, length, maType), "Selected MA", color.orange)
```
### Advanced Moving Averages
```pinescript
//@version=6
indicator("Advanced MAs")
import quantablex/moving_averages/1 as MA
// ALMA with custom offset and sigma
plot(MA.alma(close, 20, 0.85, 6), "ALMA", color.purple)
// KAMA with custom fast/slow periods
plot(MA.kama(close, 10, 2, 30), "KAMA", color.teal)
// T3 with custom volume factor
plot(MA.t3(close, 20, 0.7), "T3", color.yellow)
// Laguerre Filter with custom gamma
plot(MA.laguerreFilter(close, 0.8), "Laguerre", color.lime)
```
---
## 📈 MA Selection Guide
| Use Case | Recommended MAs |
| ---------------------- | ------------------------------------------- |
| **Trend Following** | EMA, DEMA, TEMA, HMA, CORAL |
| **Low Lag Required** | ZLEMA, HMA, EHMA, JMA, LSMA |
| **Volatile Markets** | KAMA, VIDYA, FRAMA, VMA, ADAPTIVELAGUERRE |
| **Smooth Signals** | T3, LAGUERRE, SUPERSMOOTHER, BUTTERWORTH2/3 |
| **Support/Resistance** | SMA, WMA, TMA, MEDIANMA |
| **Scalping** | MCGINLEY, ZLEMA, HMA, INSTANTTREND |
| **Noise Reduction** | MAMA, EDSMA, GWMA, TRIMMEDMA |
| **Volume-Based** | VWMA, EVWMA, VAMA |
---
## ⚙️ Parameters Reference
### Common Parameters
- `src` - Source series (close, open, hl2, hlc3, etc.)
- `len` - Period length (integer)
### Special Parameters
- `alma()`: `offset` (0-1), `sigma` (curve shape)
- `kama()`: `fastLen`, `slowLen`
- `t3()`: `vFactor` (volume factor)
- `jma()`: `phase` (-100 to 100)
- `laguerreFilter()`: `gamma` (0-1 damping)
- `rema()`: `lambda` (regularization)
- `modularFilter()`: `beta` (sensitivity)
- `gdema()`: `mult` (multiplier, 2 = standard DEMA)
- `trimmedMA()`: `trimPct` (0-0.5, percentage to trim)
- `mama()/fama()`: `fastLimit`, `slowLimit`
- `adaptiveLaguerre()`: Uses `len` for adaptation period
---
## 📝 Notes
- All 50+ functions are exported for use in any PineScript v6 indicator/strategy
- The `selector()` function supports **all MA types** via string key
- Use `getAllTypes()` to get a comma-separated list of all supported MA names
- Some MAs (CMA, INSTANTTREND, LAGUERRE, MAMA) don't use `len` parameter
- Use `nz()` wrapper if handling potential NA values in your calculations
---
**Author:** thetradingspiderman
**Version:** 1.0
**PineScript Version:** 6
**Total MA Types:** 50+

ARMA(Autoregressive Moving Average) Model -DeepALGO-📊 ARMA Model Indicator
This script is a custom indicator based on the ARMA (Autoregressive Moving Average) model, one of the fundamental and widely used models in time series analysis.
While ARMA is typically employed in statistical software, this implementation makes it accessible directly on TradingView, allowing traders to visualize and apply the dynamics of ARMA in financial markets with ease.
🧩 What is the ARMA Model?
The ARMA model explains time series data by combining two components: Autoregression (AR) and Moving Average (MA).
AR (Autoregression) component
Captures the dependence of current values on past values, modeling the inherent autocorrelation of the series.
MA (Moving Average) component
Incorporates past forecast errors (residuals), smoothing out randomness and noise while improving predictive capability.
By combining these two aspects, ARMA models can capture both the underlying structure of the data and the random fluctuations, providing a more robust description of price behavior than simple averages alone.
⚙️ Design of This Script
In classical statistics, ARMA coefficients are estimated using the ACF (Autocorrelation Function) and PACF (Partial Autocorrelation Function). However, this process is often too complex for trading environments.
This script simplifies the approach:
The coefficients theta (θ) and epsilon (ε) are fixed, automatically derived from the chosen AR and MA periods.
This eliminates the need for statistical estimation, making the indicator easy to apply with simple parameter adjustments.
The goal is not academic rigor, but practical usability for traders.
🔧 Configurable Parameters
AR Period (p): Order of the autoregressive part.
MA Period (q): Order of the moving average part. Shorter periods yield faster responsiveness, while longer periods produce smoother outputs.
Offset: Shifts the line forward or backward for easier comparison.
Smoothing Period: Additional smoothing to reduce noise.
Source: Choose from Close, HL2, HLC3, High, or Low.
🎯 Advantages Compared to Traditional Moving Averages
Commonly used moving averages such as SMA (Simple Moving Average) and EMA (Exponential Moving Average) are intuitive but have limitations:
SMA applies equal weights to past data, which makes it slow to respond to new price changes.
EMA emphasizes recent data, providing faster response but often introducing more noise and reducing smoothness.
The ARMA-based approach provides two key advantages:
Balance of Responsiveness and Smoothness
AR terms capture autocorrelation while MA terms correct residuals, resulting in a smoother line that still reacts more quickly than SMA or EMA.
Flexible Adaptation
By adjusting the MA period (q), traders can fine-tune how closely the model follows price fluctuations—ranging from rapid short-term responses to stable long-term trend recognition.
📈 Practical Use Cases
The ARMA indicator can be applied in several practical ways:
Trend Direction Estimation
The slope and position of the ARMA line can provide a straightforward read of bullish or bearish market conditions.
Trend Reversal Identification
Changes in the ARMA line’s direction may signal early signs of a reversal, often with faster reaction compared to traditional moving averages.
Confirmation with Other Indicators
Combine ARMA with oscillators such as RSI or MACD to improve the reliability of signals.
Combination with Heikin-Ashi
Heikin-Ashi candles smooth out price action and highlight trend changes. When used together with ARMA, they can significantly enhance reversal detection. For example, if Heikin-Ashi indicates a potential reversal and the ARMA line simultaneously changes direction, the confluence provides a stronger and more reliable trading signal.
⚠️ Important Notes
Risk of Overfitting
Excessive optimization of AR or MA periods may lead to overfitting, where the indicator fits historical data well but fails to generalize to future market conditions. Keep parameter choices simple and consistent.
Weakness in Sideways Markets
ARMA works best in trending environments. In range-bound conditions, signals may become noisy or less reliable. Consider combining it with range-detection tools or volume analysis.
Not a Standalone System
This indicator should not be used in isolation for trading decisions. It is best employed as part of a broader analysis framework, combining multiple indicators and fundamental insights.
💡 Summary
This script brings the theoretical foundation of ARMA into a practical, chart-based tool for traders.
It is particularly valuable for those who find SMA too lagging or EMA too noisy, offering a more nuanced balance between responsiveness and smoothness.
By capturing both autocorrelation and residual structure, ARMA provides a deeper view of market dynamics.
Combined with tools such as Heikin-Ashi or oscillators, it can significantly enhance trend reversal detection and strategy reliability.

HMA Trend Line (Croc Signal Line)HMA Trend Line (Croc Signal Line) — The Ultimate Hull Moving Average Trend Indicator
Full English description here:
What is the HMA Trend Line (Croc Signal Line)?
The HMA Trend Line (Croc Signal Line) is a powerful, adaptive trend indicator for TradingView, based on the Hull Moving Average (HMA). This indicator is designed to help traders identify real market trends with less lag and reduced noise compared to traditional moving averages like SMA (Simple Moving Average) and EMA (Exponential Moving Average).
Why use the HMA Trend Line?
+ Faster Trend Detection: The Hull Moving Average (HMA) responds more quickly to price action, giving you earlier buy and sell signals.
+ Smoother and Cleaner: It provides a visually clean trend line that avoids the choppiness of classic EMAs and SMAs.
+ Reduced Lag: The HMA Trend Line follows the market closer, helping you avoid late entries or exits and spot trend reversals sooner.
+ Dynamic Support and Resistance: Use the line as a dynamic support or resistance to manage trades and identify pullbacks or breakouts.
What does “Croc Signal Line” mean?
The “Croc” in Croc Signal Line stands for:
+ Clean
+ Responsive
+ Optimized
+ Curve
This highlights the unique advantage of this indicator: a curve that is both fast-reacting and smooth, helping traders focus on real trends and filter out market noise.
How does the Hull Moving Average (HMA) work?
The HMA was developed by Alan Hull and uses weighted moving averages and a unique calculation to deliver both responsiveness and smoothness. Unlike standard moving averages, the HMA reacts faster to new price moves and avoids false signals in ranging or volatile markets.
How to use the HMA Trend Line (Croc Signal Line) on TradingView?
+ Watch for price crossing above the trend line for potential bullish signals, and below for bearish signals.
+ Use on any timeframe: from 1-minute scalping to daily, weekly, or even monthly charts.
+ Works with all asset classes: Forex, stocks, indices, cryptocurrencies, commodities, and futures.
+ Combine with other indicators (like Stochastics, RSI, or volume) for confirmation and to build your unique trading strategy.
+ Adjust the Signal Line Period for your market and style: shorter periods for faster markets, longer for smoother trends.
Who should use this indicator?
+ Day traders, swing traders, and long-term investors looking for reliable, actionable trend signals.
+ Anyone seeking a cleaner, more responsive alternative to the classic moving averages.
+ Traders who want a simple, visually clear way to filter out market noise and see real price direction.
Disclaimer:
This indicator is for educational and study purposes only. Please perform your own backtesting and analysis before using it in live trading. This script does not constitute financial advice. Use at your own risk.
--------

Toolbar-FrenToolbar-Fren is a comprehensive, data-rich toolbar designed to present a wide array of key metrics in a compact and intuitive format. The core philosophy of this indicator is to maximize the amount of relevant, actionable data available to the trader while occupying minimal chart space. It leverages a dynamic color-coded system to provide at-a-glance insights into market conditions, instantly highlighting positive/negative values, trend strength, and proximity to important technical levels.
Features and Data Displayed
The toolbar displays a vertical column of critical data points, primarily calculated on the Daily timeframe to give a broader market context. Each cell is color-coded for quick interpretation.
DAY:
The percentage change of the current price compared to the previous day's close. The cell is colored green for a positive change and red for a negative one.
LOD:
The current price's percentage distance from the Low of the Day.
HOD
The current price's percentage distance from the High of the Day.
MA Distances (9/21 or 10/20, 50, 200)
These cells show how far the current price is from key Daily moving averages (MAs).
The values are displayed either as a percentage distance or as a multiple of the Average Daily Range (ADR), which can be toggled in the settings.
The cells are colored green if the price is above the corresponding MA (bullish) and red if it is below (bearish).
ADR
Shows the 14-period Average Daily Range as a percentage of the current price. The cell background uses a smooth gradient from green (low volatility) to red (high volatility) to visualize the current daily range expansion.
ADR%/50: A unique metric showing the distance from the Daily 50 SMA, measured in multiples of the 14-period Average True Range (ATR). This helps quantify how extended the price is from its mean. The cell is color-coded from green (close to the mean) to red (highly extended).
RSI
The standard 14-period Relative Strength Index calculated on the Daily timeframe. The background color changes to indicate potentially overbought (orange/red) or oversold (green) conditions.
ADX
The 14-period Average Directional Index (ADX) from the Daily timeframe, which measures trend strength. The cell is colored to reflect the strength of the trend (e.g., green for a strong trend, red for a weak/non-trending market). An arrow (▲/▼) is also displayed to indicate if the ADX value is sloping up or down.
User Customization
The indicator offers several options for personalization to fit your trading style and visual preferences:
MA Type
Choose between using Exponential Moving Averages (EMA 9/21) or Simple Moving Averages (SMA 10/20) for the primary MA calculations.
MA Distance Display
Toggle the display of moving average distances between standard percentage values and multiples of the Average Daily Range (ADR).
Display Settings
Fully customize the on-chart appearance by selecting the table's position (e.g., Top Right, Bottom Left) and the text size. An option for a larger top margin is also available.
Colors
Personalize the core Green, Yellow, Orange, and Red colors used throughout the indicator to match your chart's theme.
Technical Parameters
Fine-tune the length settings for the ADX and DI calculations.

DECODE Moving Average ToolkitDECODE Moving Average Toolkit: Your All-in-One MA Analysis Powerhouse!
This versatile indicator is designed to be your go-to solution for analysing trends, identifying potential entry/exit points, and staying ahead of market movements using the power of Moving Averages (MAs).
Whether you're a seasoned trader or just starting out, the Decode MAT offers a comprehensive suite of features in a user-friendly package.
Key Features:
Multiple Moving Averages: Visualize up to 10 Moving Averages simultaneously on your chart.
Includes 5 Exponential Moving Averages (EMAs) and 5 Simple Moving Averages (SMAs).
Easily toggle the visibility of each MA and customize its length to suit your trading style and the asset you're analyzing.
Dynamic MA Ribbons: Gain a clearer perspective on trend direction and strength with 5 configurable MA Ribbons.
Each ribbon is formed between a corresponding EMA and SMA (e.g., EMA 20 / SMA 20).
The ribbon color changes to indicate bullish (e.g., green) or bearish (e.g., red) sentiment, providing an intuitive visual cue.
Toggle ribbon visibility with a single click.
Powerful Crossover Alerts: Never miss a potential trading opportunity with up to 5 customizable MA Crossover Alerts.
Define your own fast and slow MAs for each alert from any of the 10 available MAs.
Receive notifications directly through TradingView when your specified MAs cross over or cross under.
Optionally display visual symbols (e.g., triangles ▲▼) directly on your chart at the exact crossover points for quick identification.
Highly Customizable:
Adjust the source price (close, open, etc.) for all MA calculations.
Fine-tune the appearance (colors, line thickness) of every MA line, ribbon, and alert symbol to match your charting preferences.
User-Friendly Interface: All settings are neatly organized in the indicator's input menu, making configuration straightforward and intuitive.
How Can You Use the Decode MAT in Your Trading?
This toolkit is incredibly versatile and can be adapted to various trading strategies:
Trend Identification:
Use longer-term MAs (e.g., 50, 100, 200 period) to identify the prevailing market trend. When prices are consistently above these MAs, it suggests an uptrend, and vice-versa.
Observe the MA ribbons: A consistently green ribbon can indicate a strong uptrend, while a red ribbon can signal a downtrend. The widening or narrowing of the ribbon can also suggest changes in trend momentum.
Dynamic Support & Resistance:
Shorter-term MAs (e.g., 10, 20 period EMAs) can act as dynamic levels of support in an uptrend or resistance in a downtrend. Look for price pullbacks to these MAs as potential entry opportunities.
Crossover Signals (Entries & Exits):
Golden Cross / Death Cross: Configure alerts for classic crossover signals. For example, a 50-period MA crossing above a 200-period MA (Golden Cross) is often seen as a long-term bullish signal. Conversely, a 50-period MA crossing below a 200-period MA (Death Cross) can be a bearish signal.
Shorter-Term Signals: Use crossovers of shorter-term MAs (e.g., EMA 10 crossing EMA 20) for more frequent, shorter-term trading signals. A fast MA crossing above a slow MA can signal a buy, while a cross below can signal a sell.
Use the on-chart symbols for quick visual confirmation of these crossover events.
Confirmation Tool:
Combine the Decode MAT with other indicators (like RSI, MACD, or volume analysis) to confirm signals and increase the probability of successful trades. For instance, a bullish MA crossover combined with an oversold RSI reading could strengthen a buy signal.
Multi-Timeframe Analysis:
Apply the toolkit across different timeframes to get a broader market perspective. A long-term uptrend on the daily chart, confirmed by a short-term bullish crossover on the 1-hour chart, can provide a higher-confidence entry.
The DECODE Moving Average Toolkit empowers you to tailor your MA analysis precisely to your needs.
